T-Bank


Dates:
November 2024 —
May 2026

Role:
Design Group Lead

Scope:
Design Leadership
Product Design
At T-Bank, I was responsible for the design of the mobile investing and trading app, working with the teams covering asset selection, trading and tracking financial performance. Over more than a year and a half, we redesigned and launched the asset purchase and trading flows. I also initiated redesigns of asset detail pages and portfolio analytics, taking both through to development.


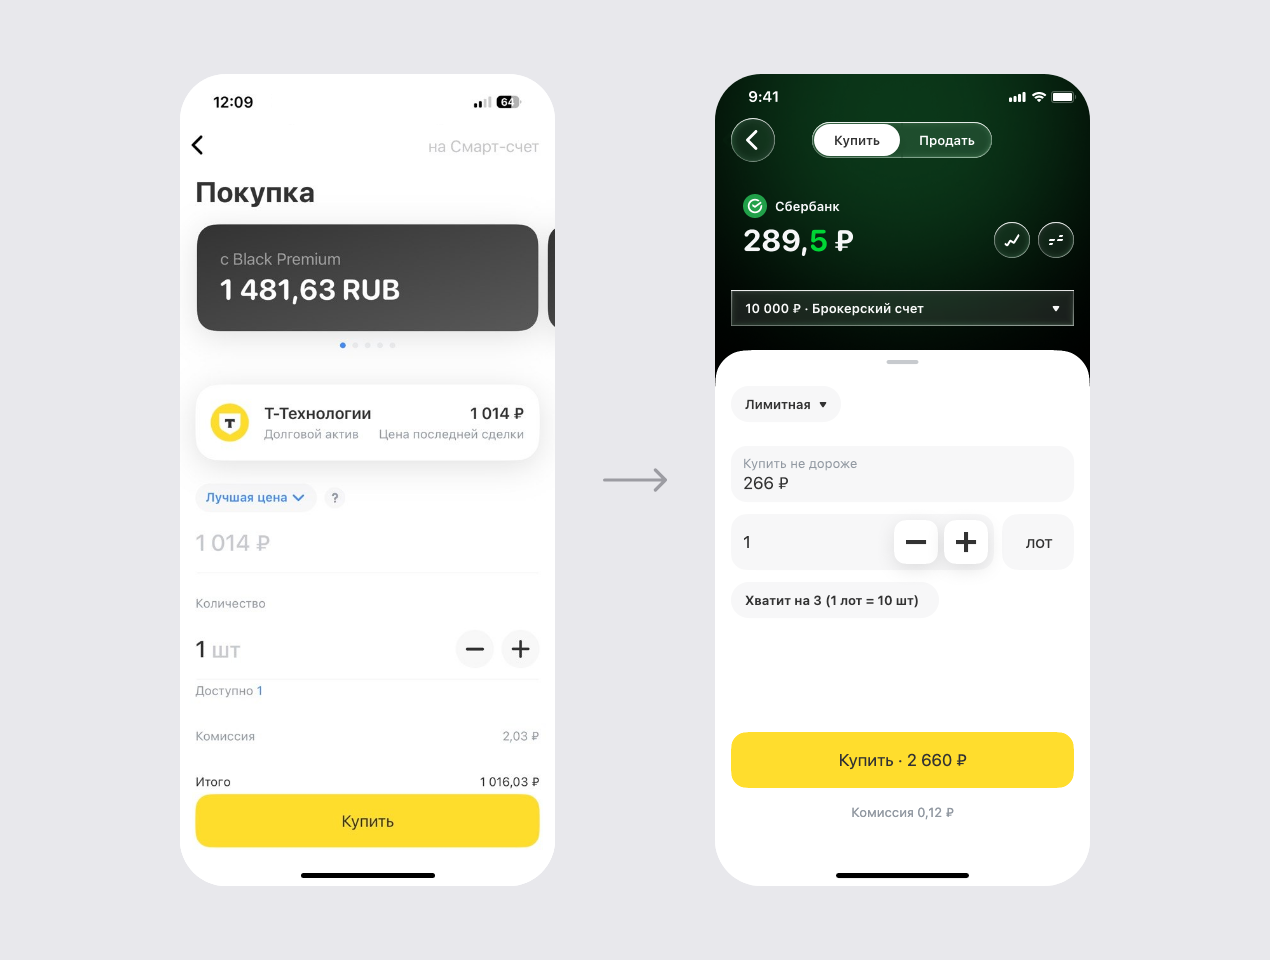
TradingWith restrictions on access to foreign assets, the business was putting more focus on trading, but the app made it difficult to trade on a phone. Beginners struggled to find their way around, while experienced traders had to keep switching screens to manage multiple positions.


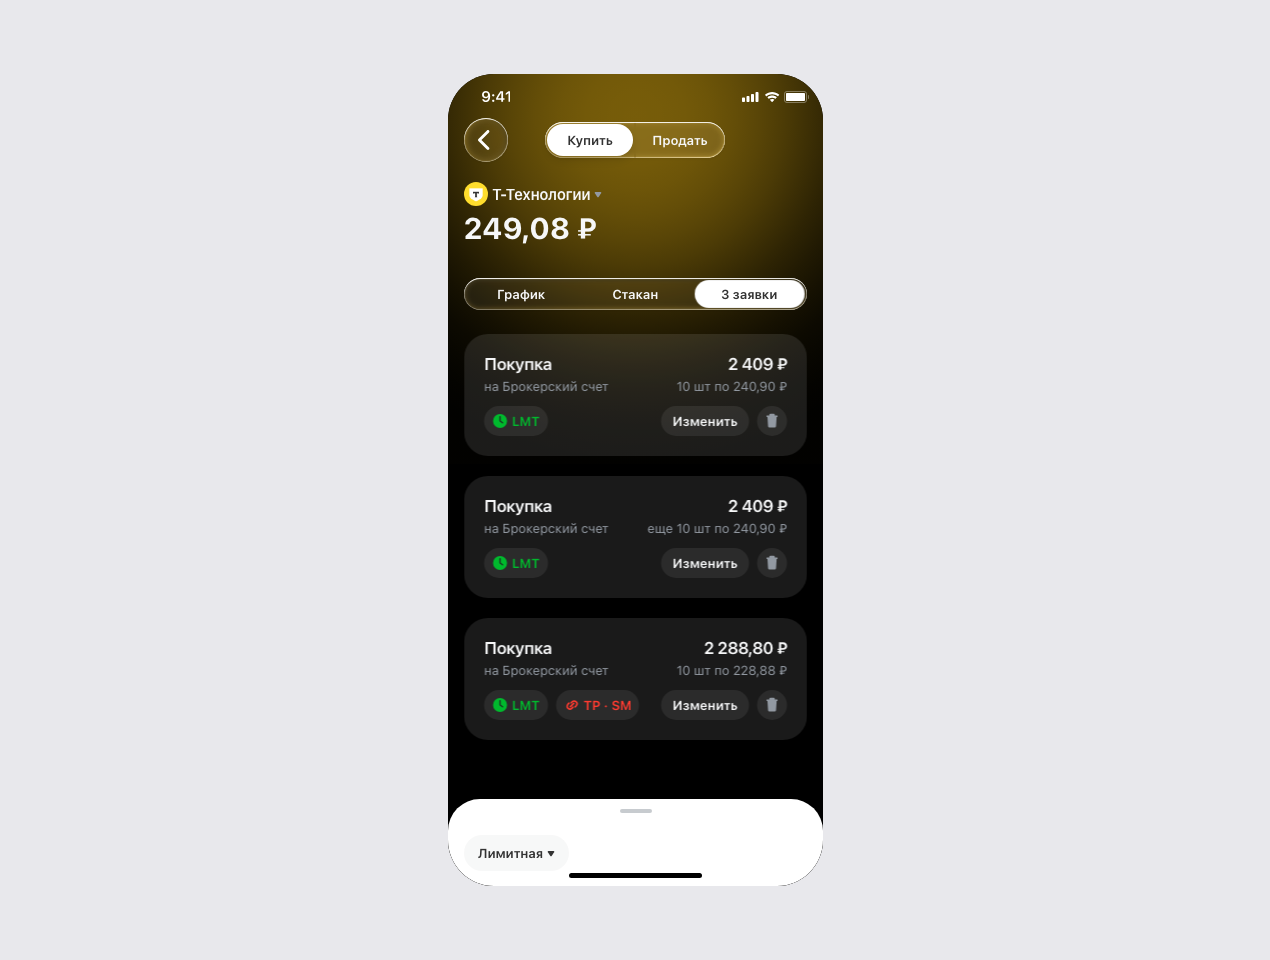
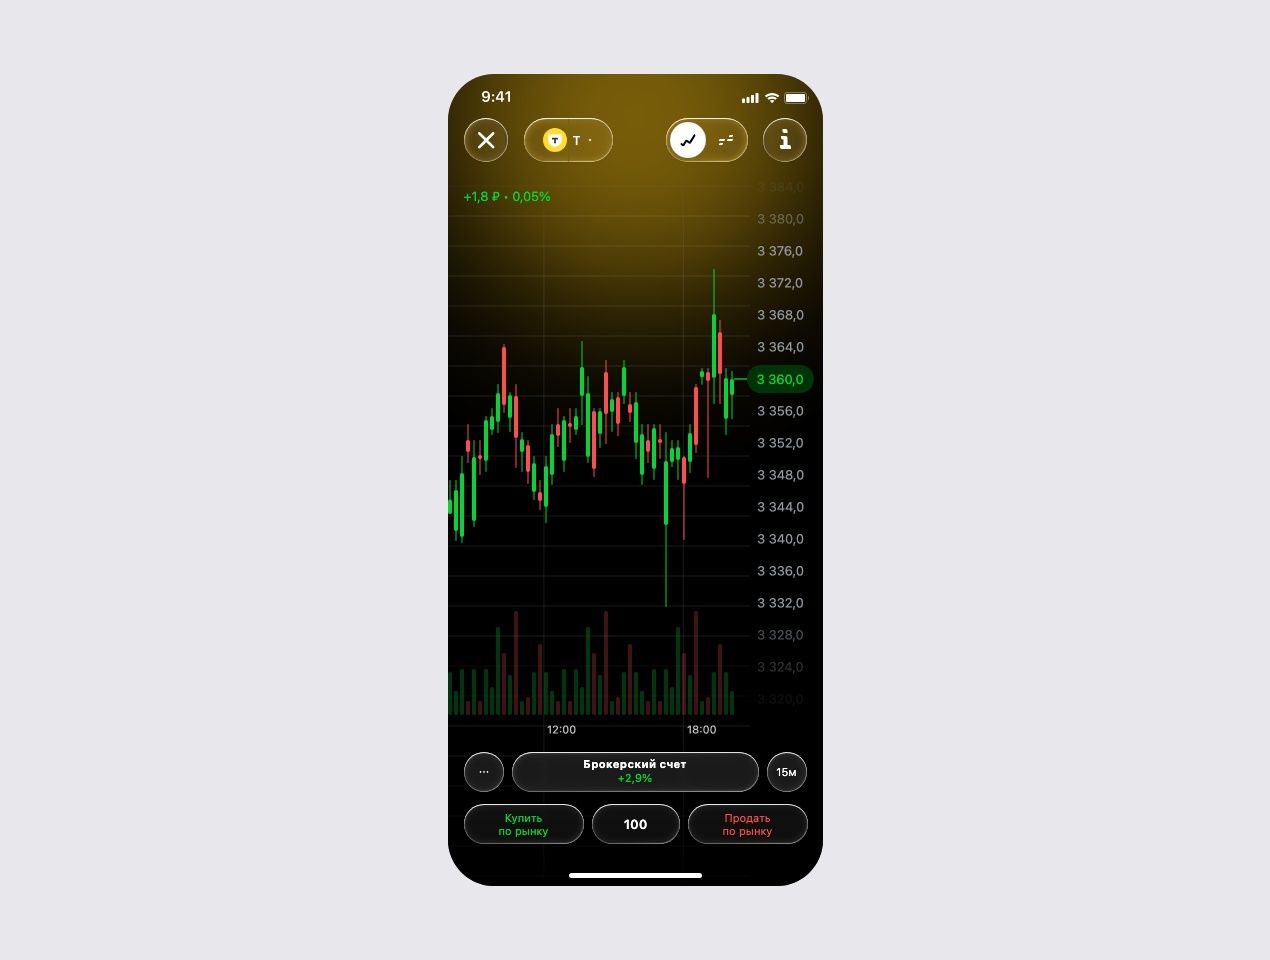
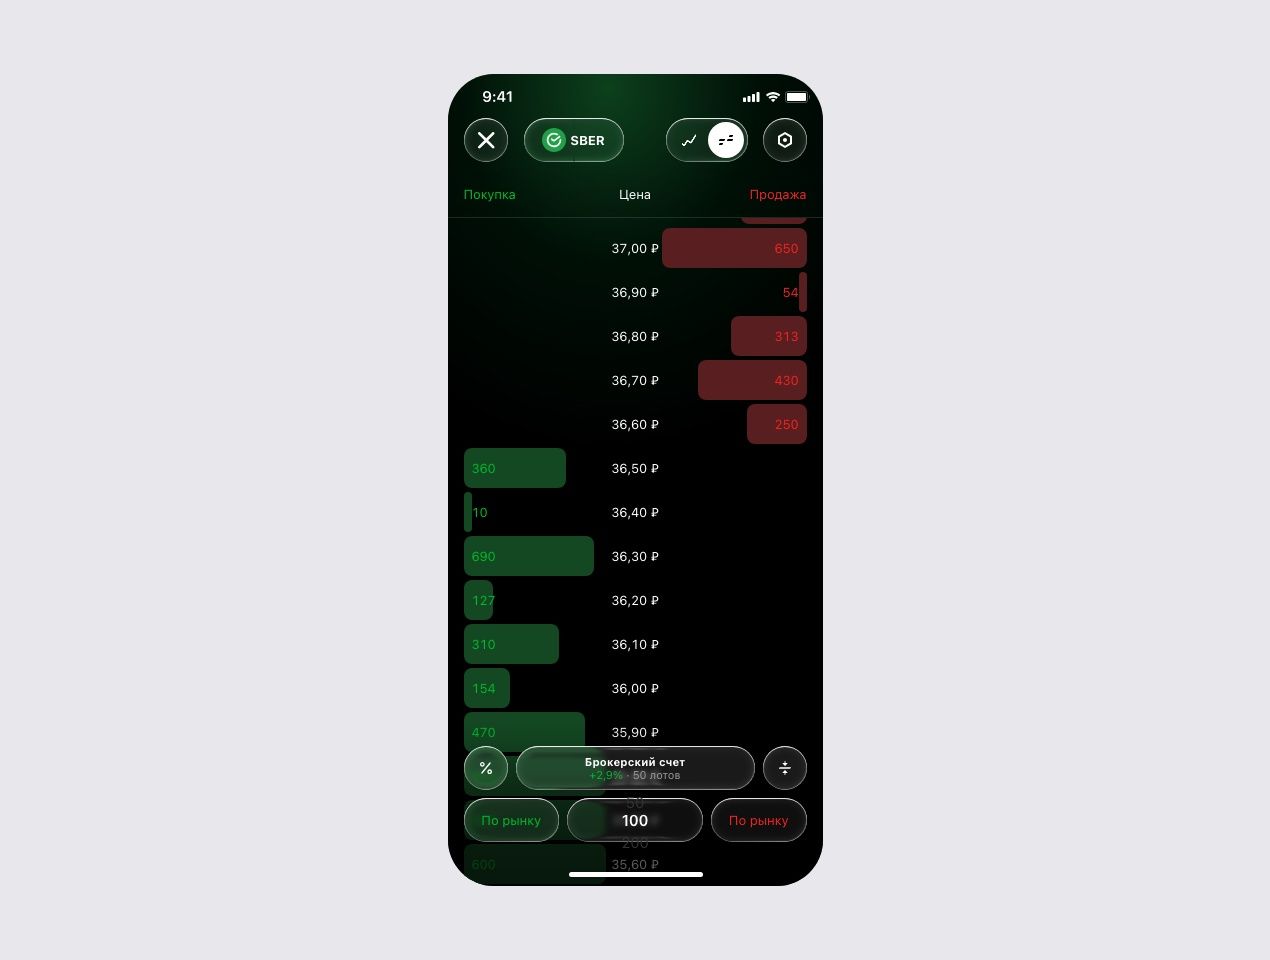
We brought the order form, chart, order book and active order management into a single trading mode. Users can adjust the complexity as they go: start with the order form, add the chart and order book, or open them full screen and place orders with gestures. We tested the new interactions with clients in the office. These sessions also gave us ideas for the future backlog. After launch, conversion to a trade increased by 5% among traders and investors.


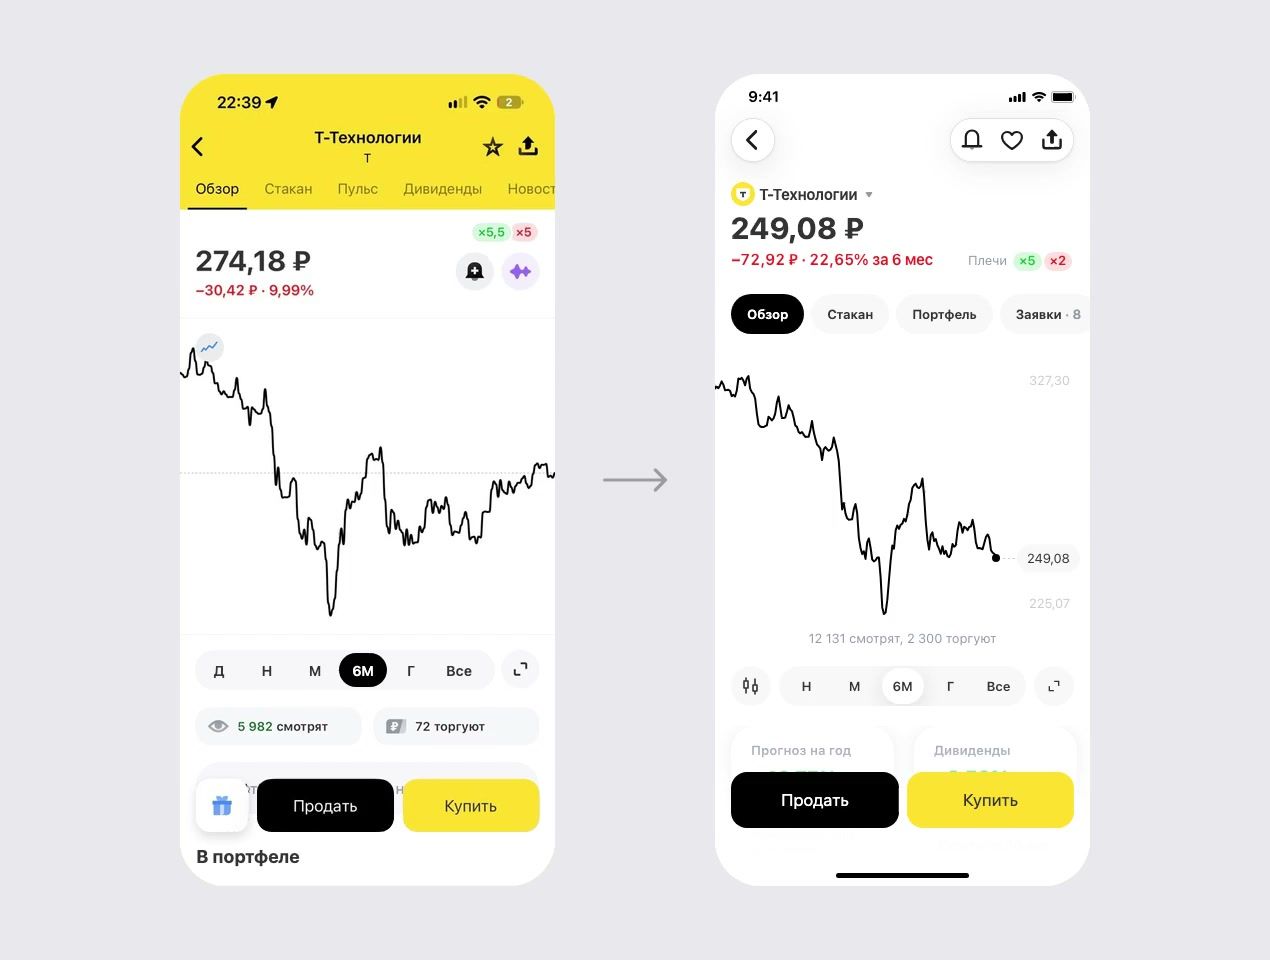
Asset detail pagesI initiated the redesign, brought designers into the concept work, got business approval for the ideas and found a product manager who helped take the initiative through to development.

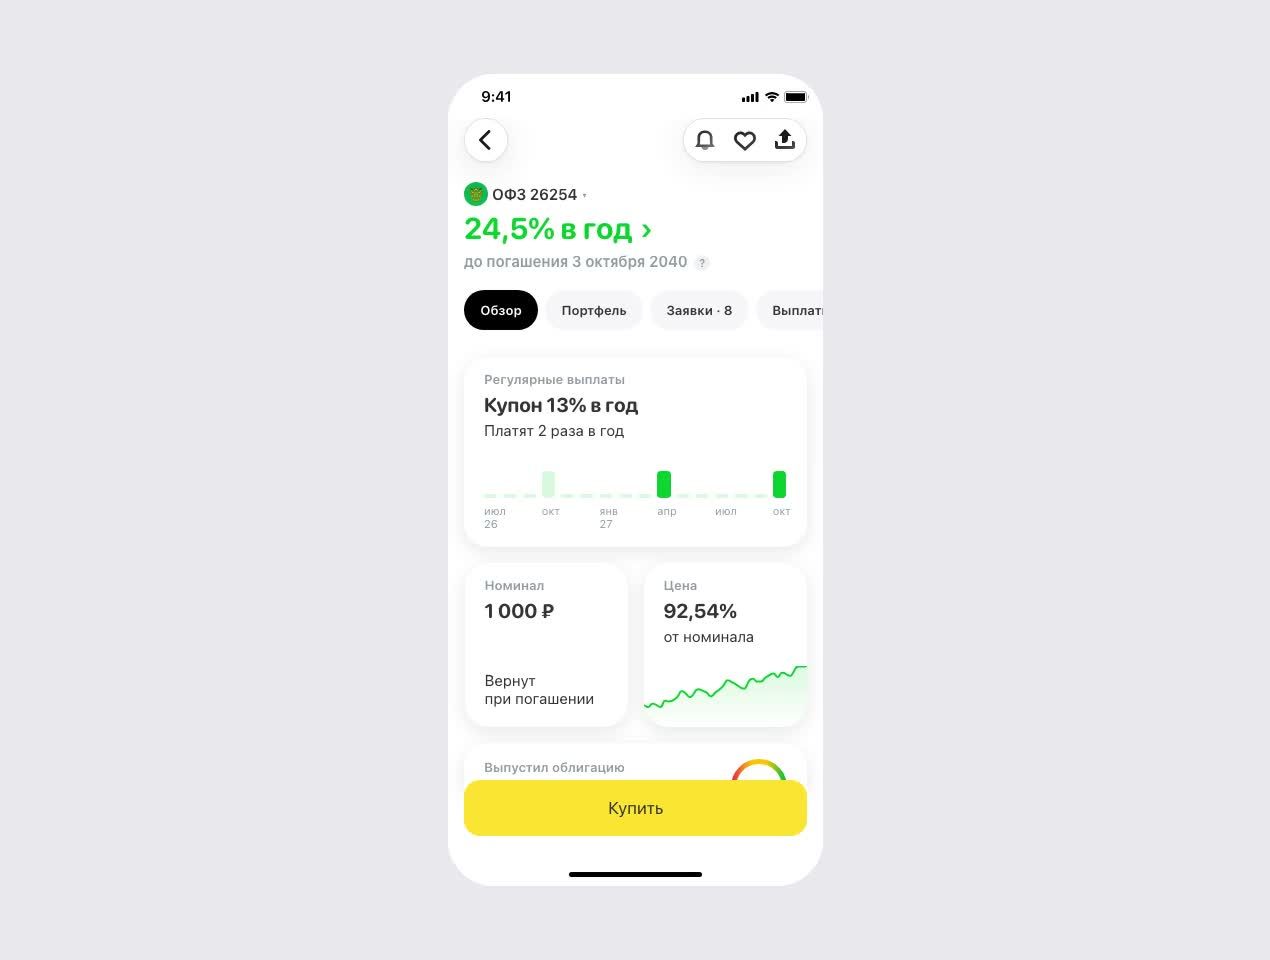
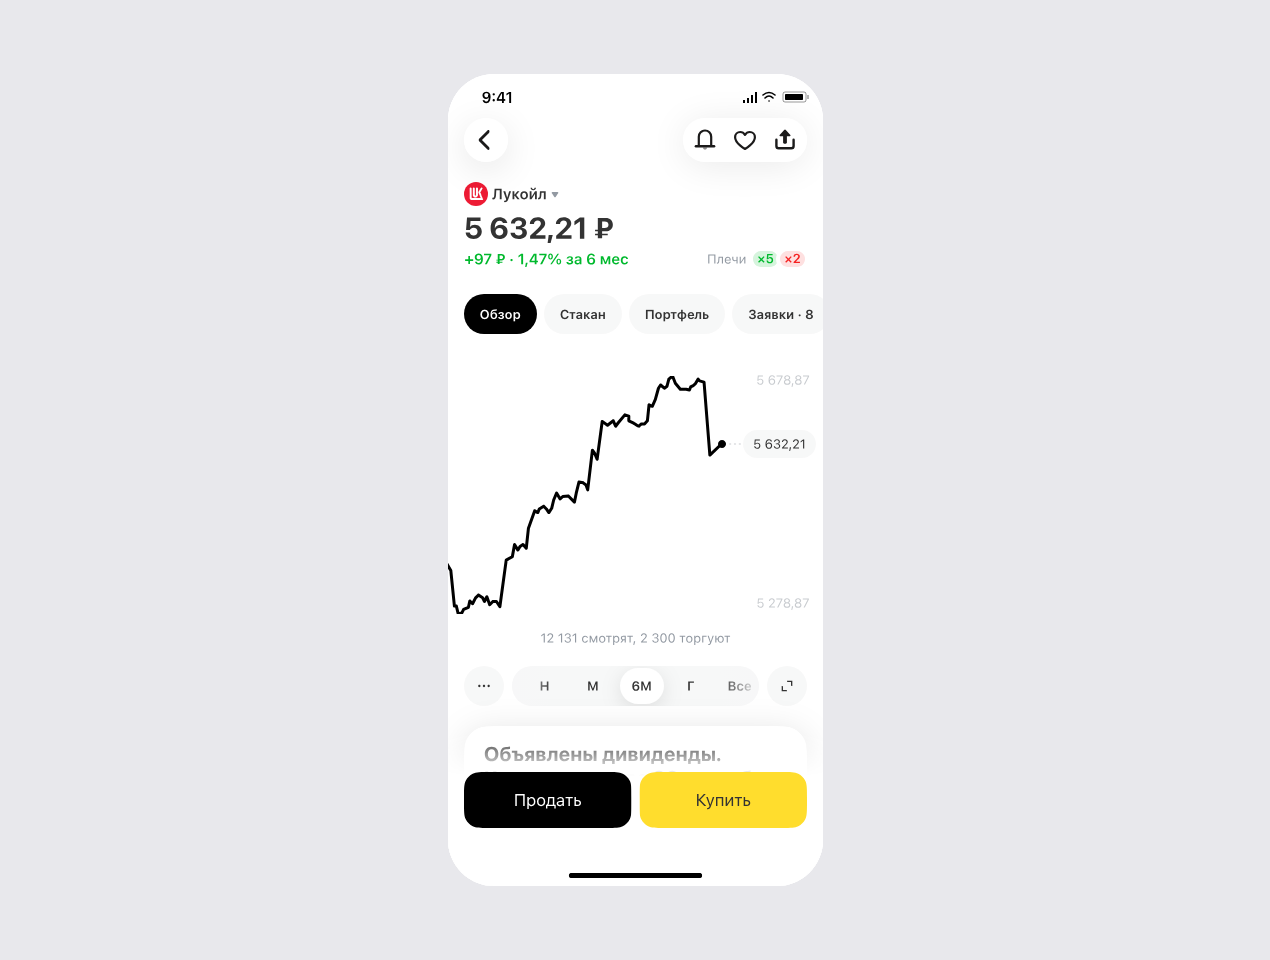
Stocks, bonds and other instruments work differently, but their detail pages looked the same. We kept a familiar layout and changed the emphasis in the content. For example, stocks get the chart, dividends and analyst forecasts, while bonds get yield, the payment schedule and credit rating. We took the same approach to every other instrument: funds, futures, options, currencies, metals and more.
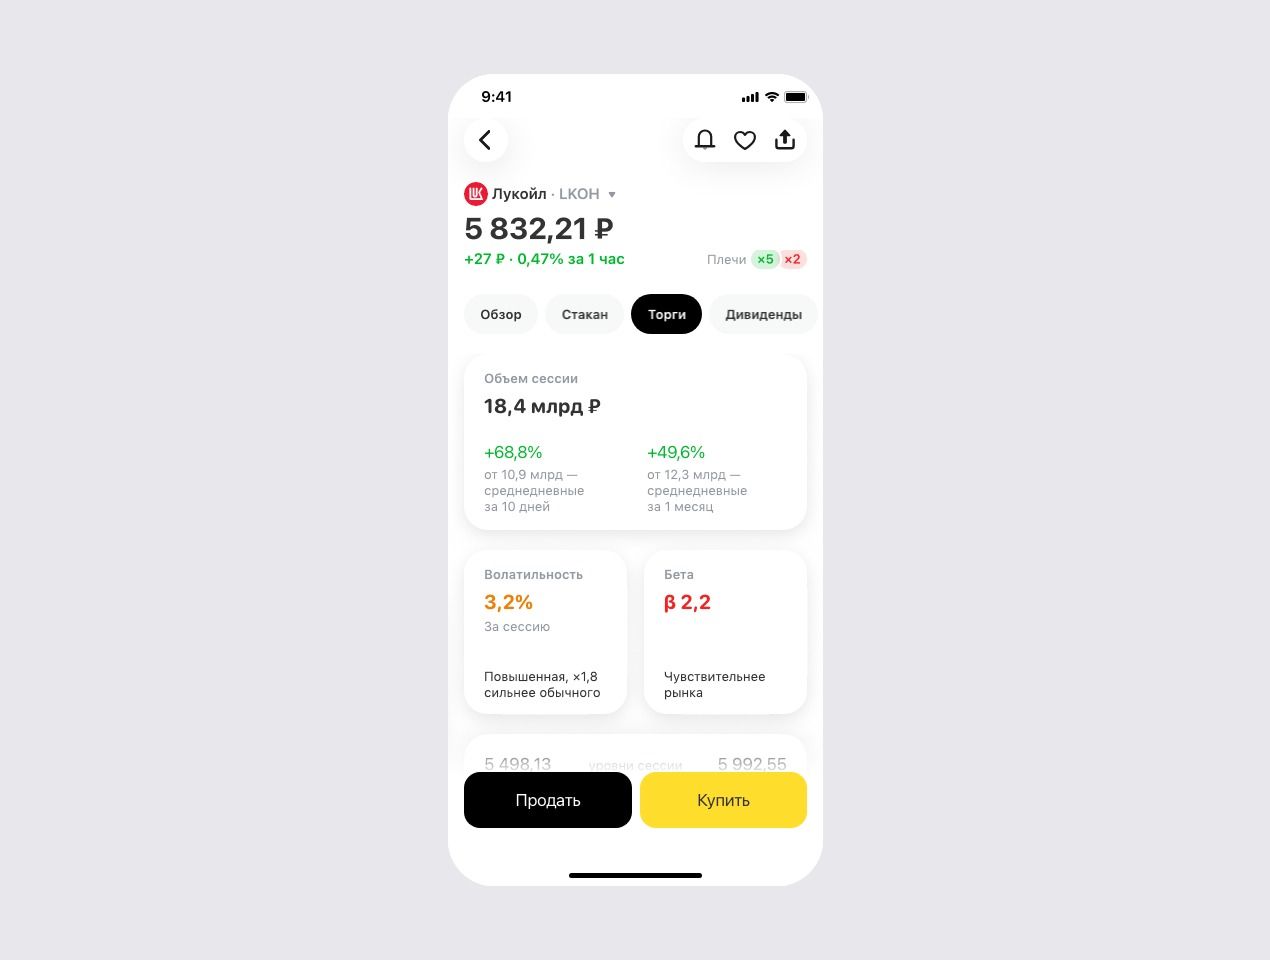


I also proposed adapting the interface to different approaches to investing. We designed the Overview tab to adapt automatically to the user’s segment, with manual widget selection: technical analysis for trading or fundamental indicators for long-term investing. Users who both invest and trade can combine these options. The section menu on the detail page also adapts to the segment, and users can tailor it to their needs.


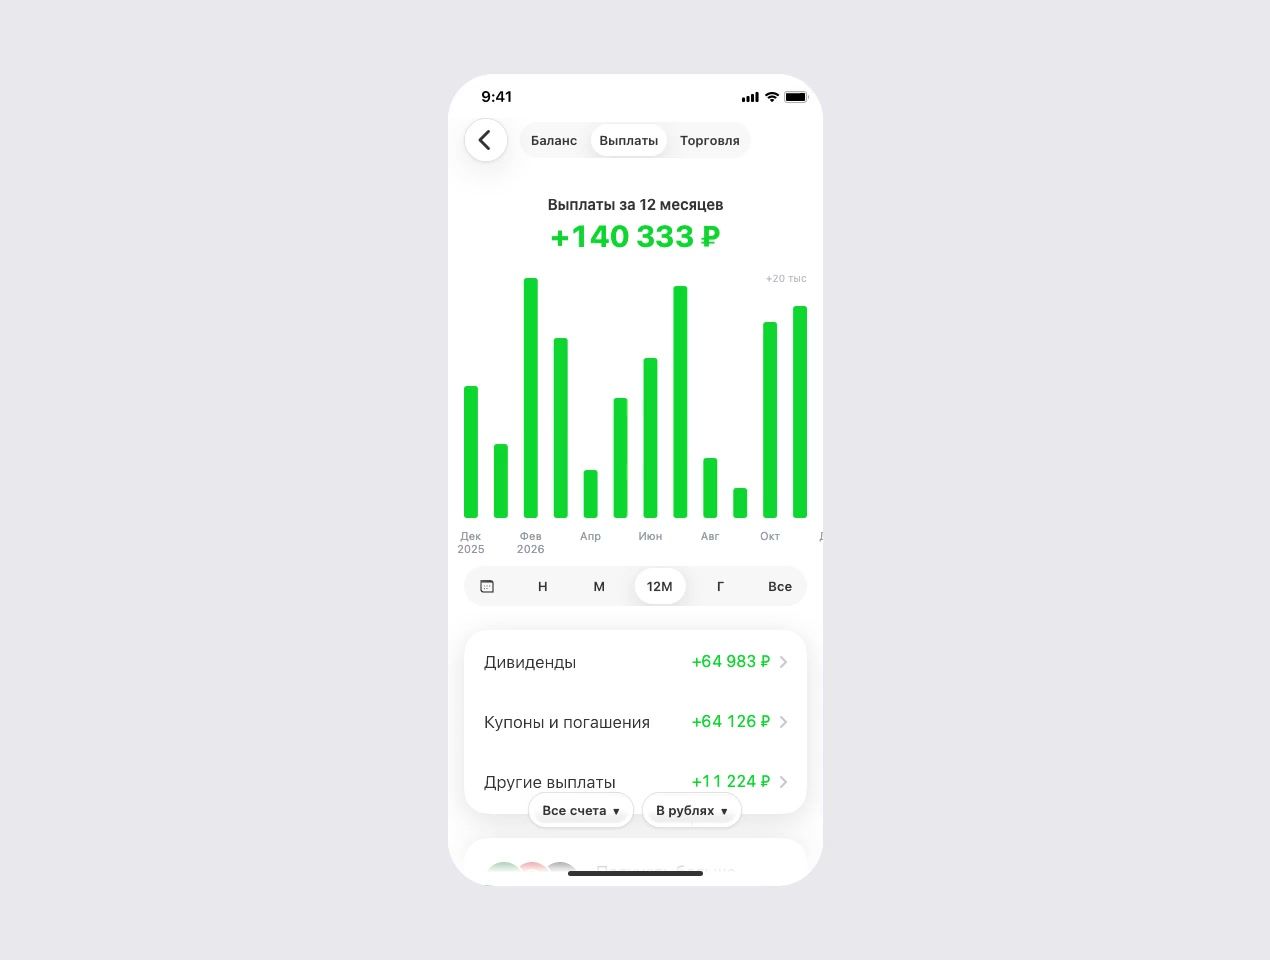
Portfolio analyticsAs an investor, I wanted the analytics to explain what made up my balance and how effectively I was investing in different instruments. I proposed redesigning the section. We broke down the balance into deposits and withdrawals, changes in the value of open positions and results from closed trades. We also showed income from dividends and coupons, and deductions for taxes and fees.

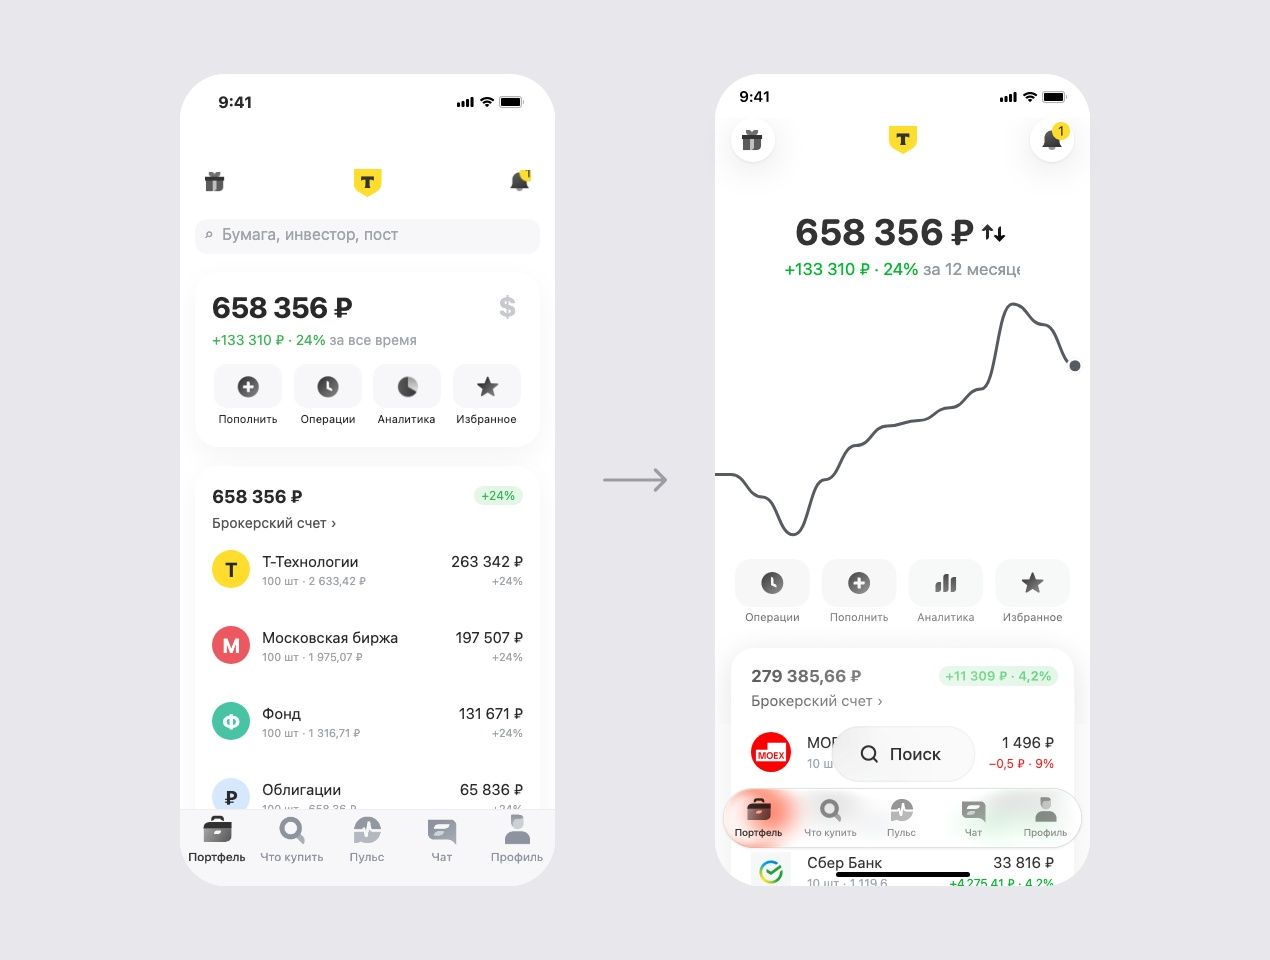
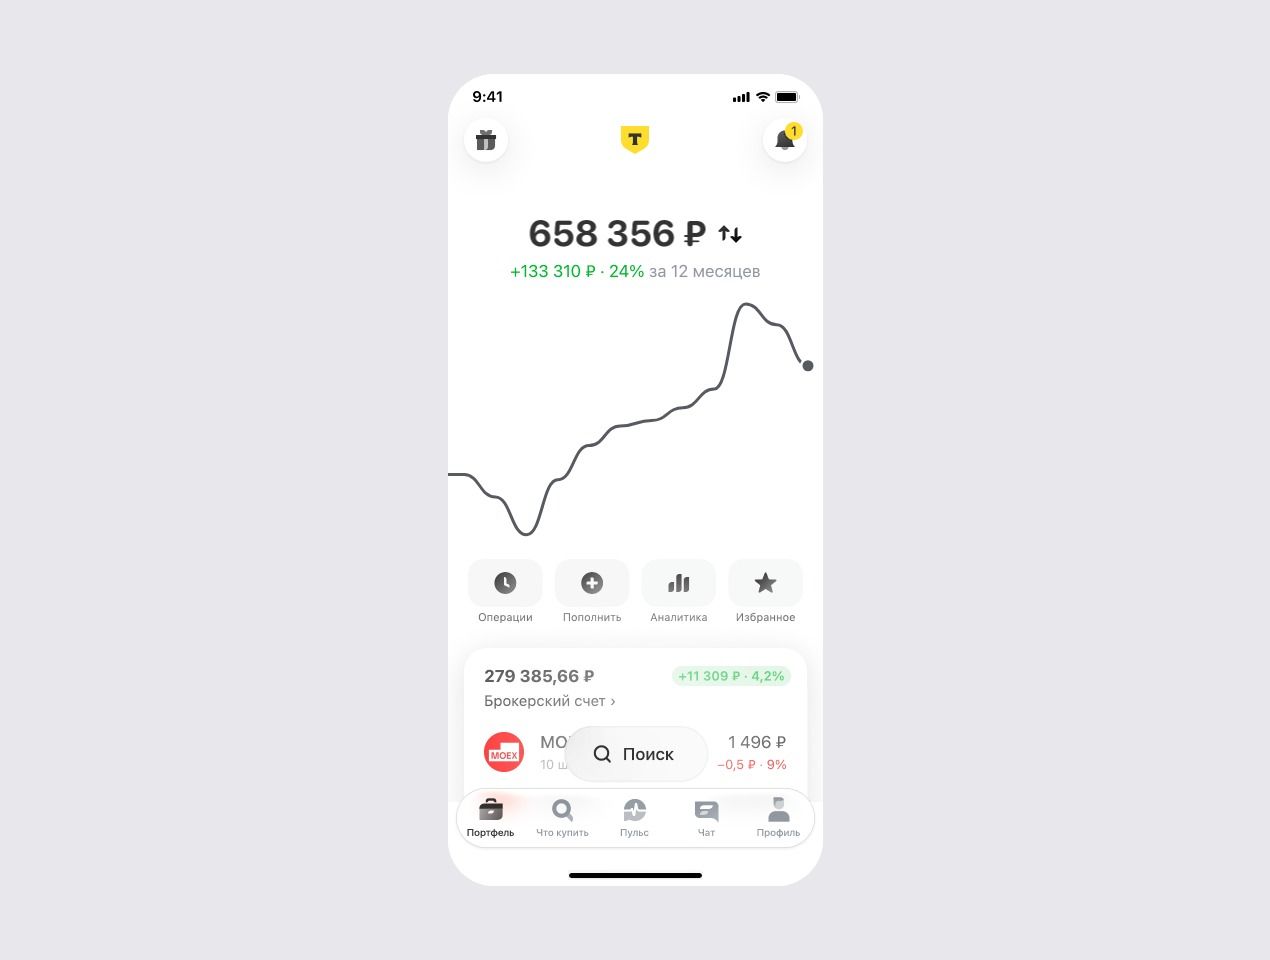
Conversations with clients helped us distinguish their needs: traders wanted a chart of financial performance over a period, while investors wanted quick access to their balance and its chart. In the new design, we moved both charts to the home screen, with a way to switch between them.
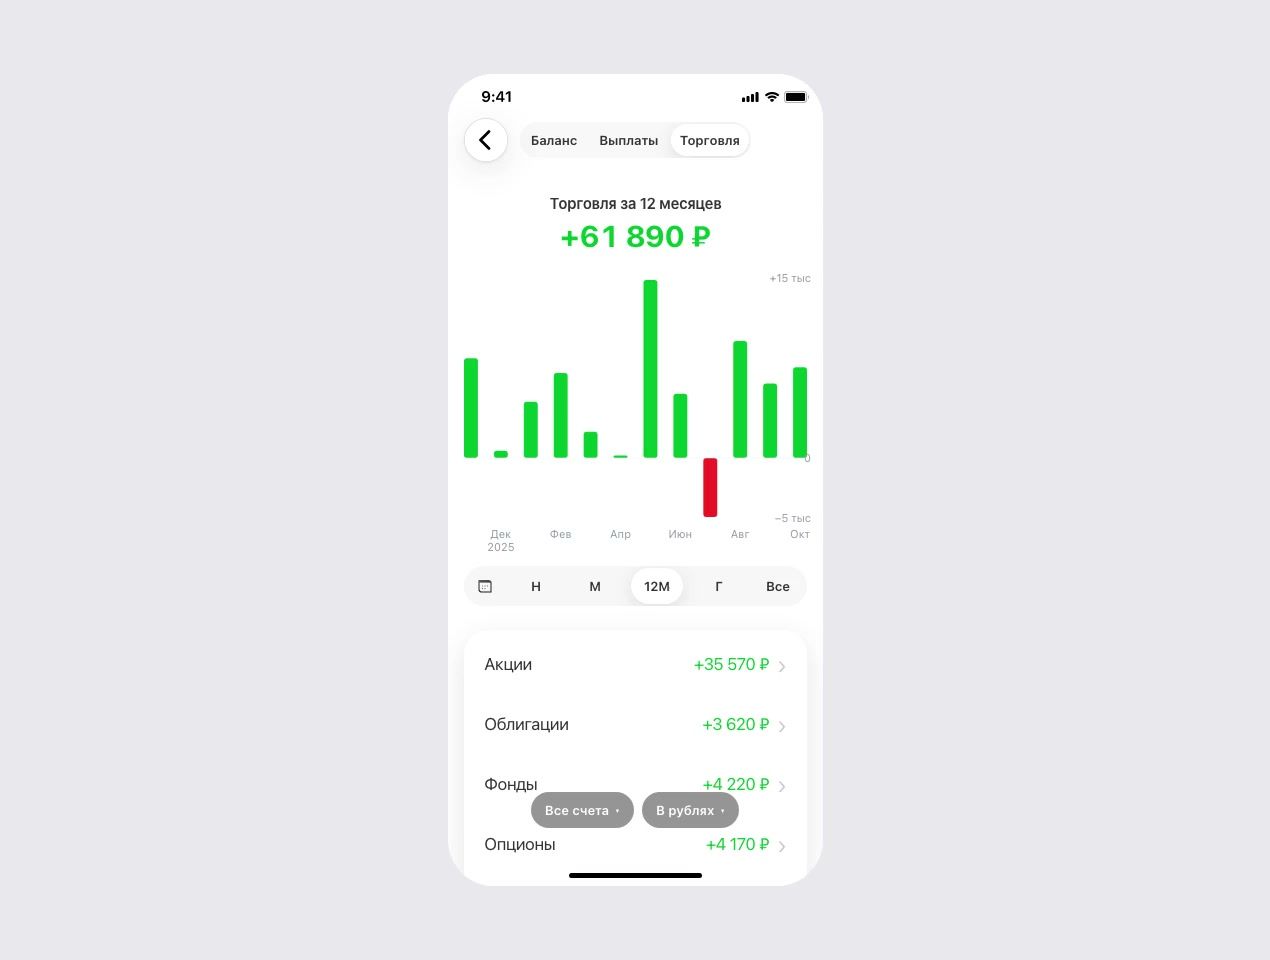


The three sections address different goals: Balance for investing overall, Income for passive income, and Trading for profiting from price movements. Each section has a chart for the selected period and a breakdown of its components. Users can drill down from the overall result to an instrument type and an individual asset, or scroll forward in the income chart to see a forecast.